

Part 7 of 8
How do we blend all these inputs of different types into a system with feedback loops?
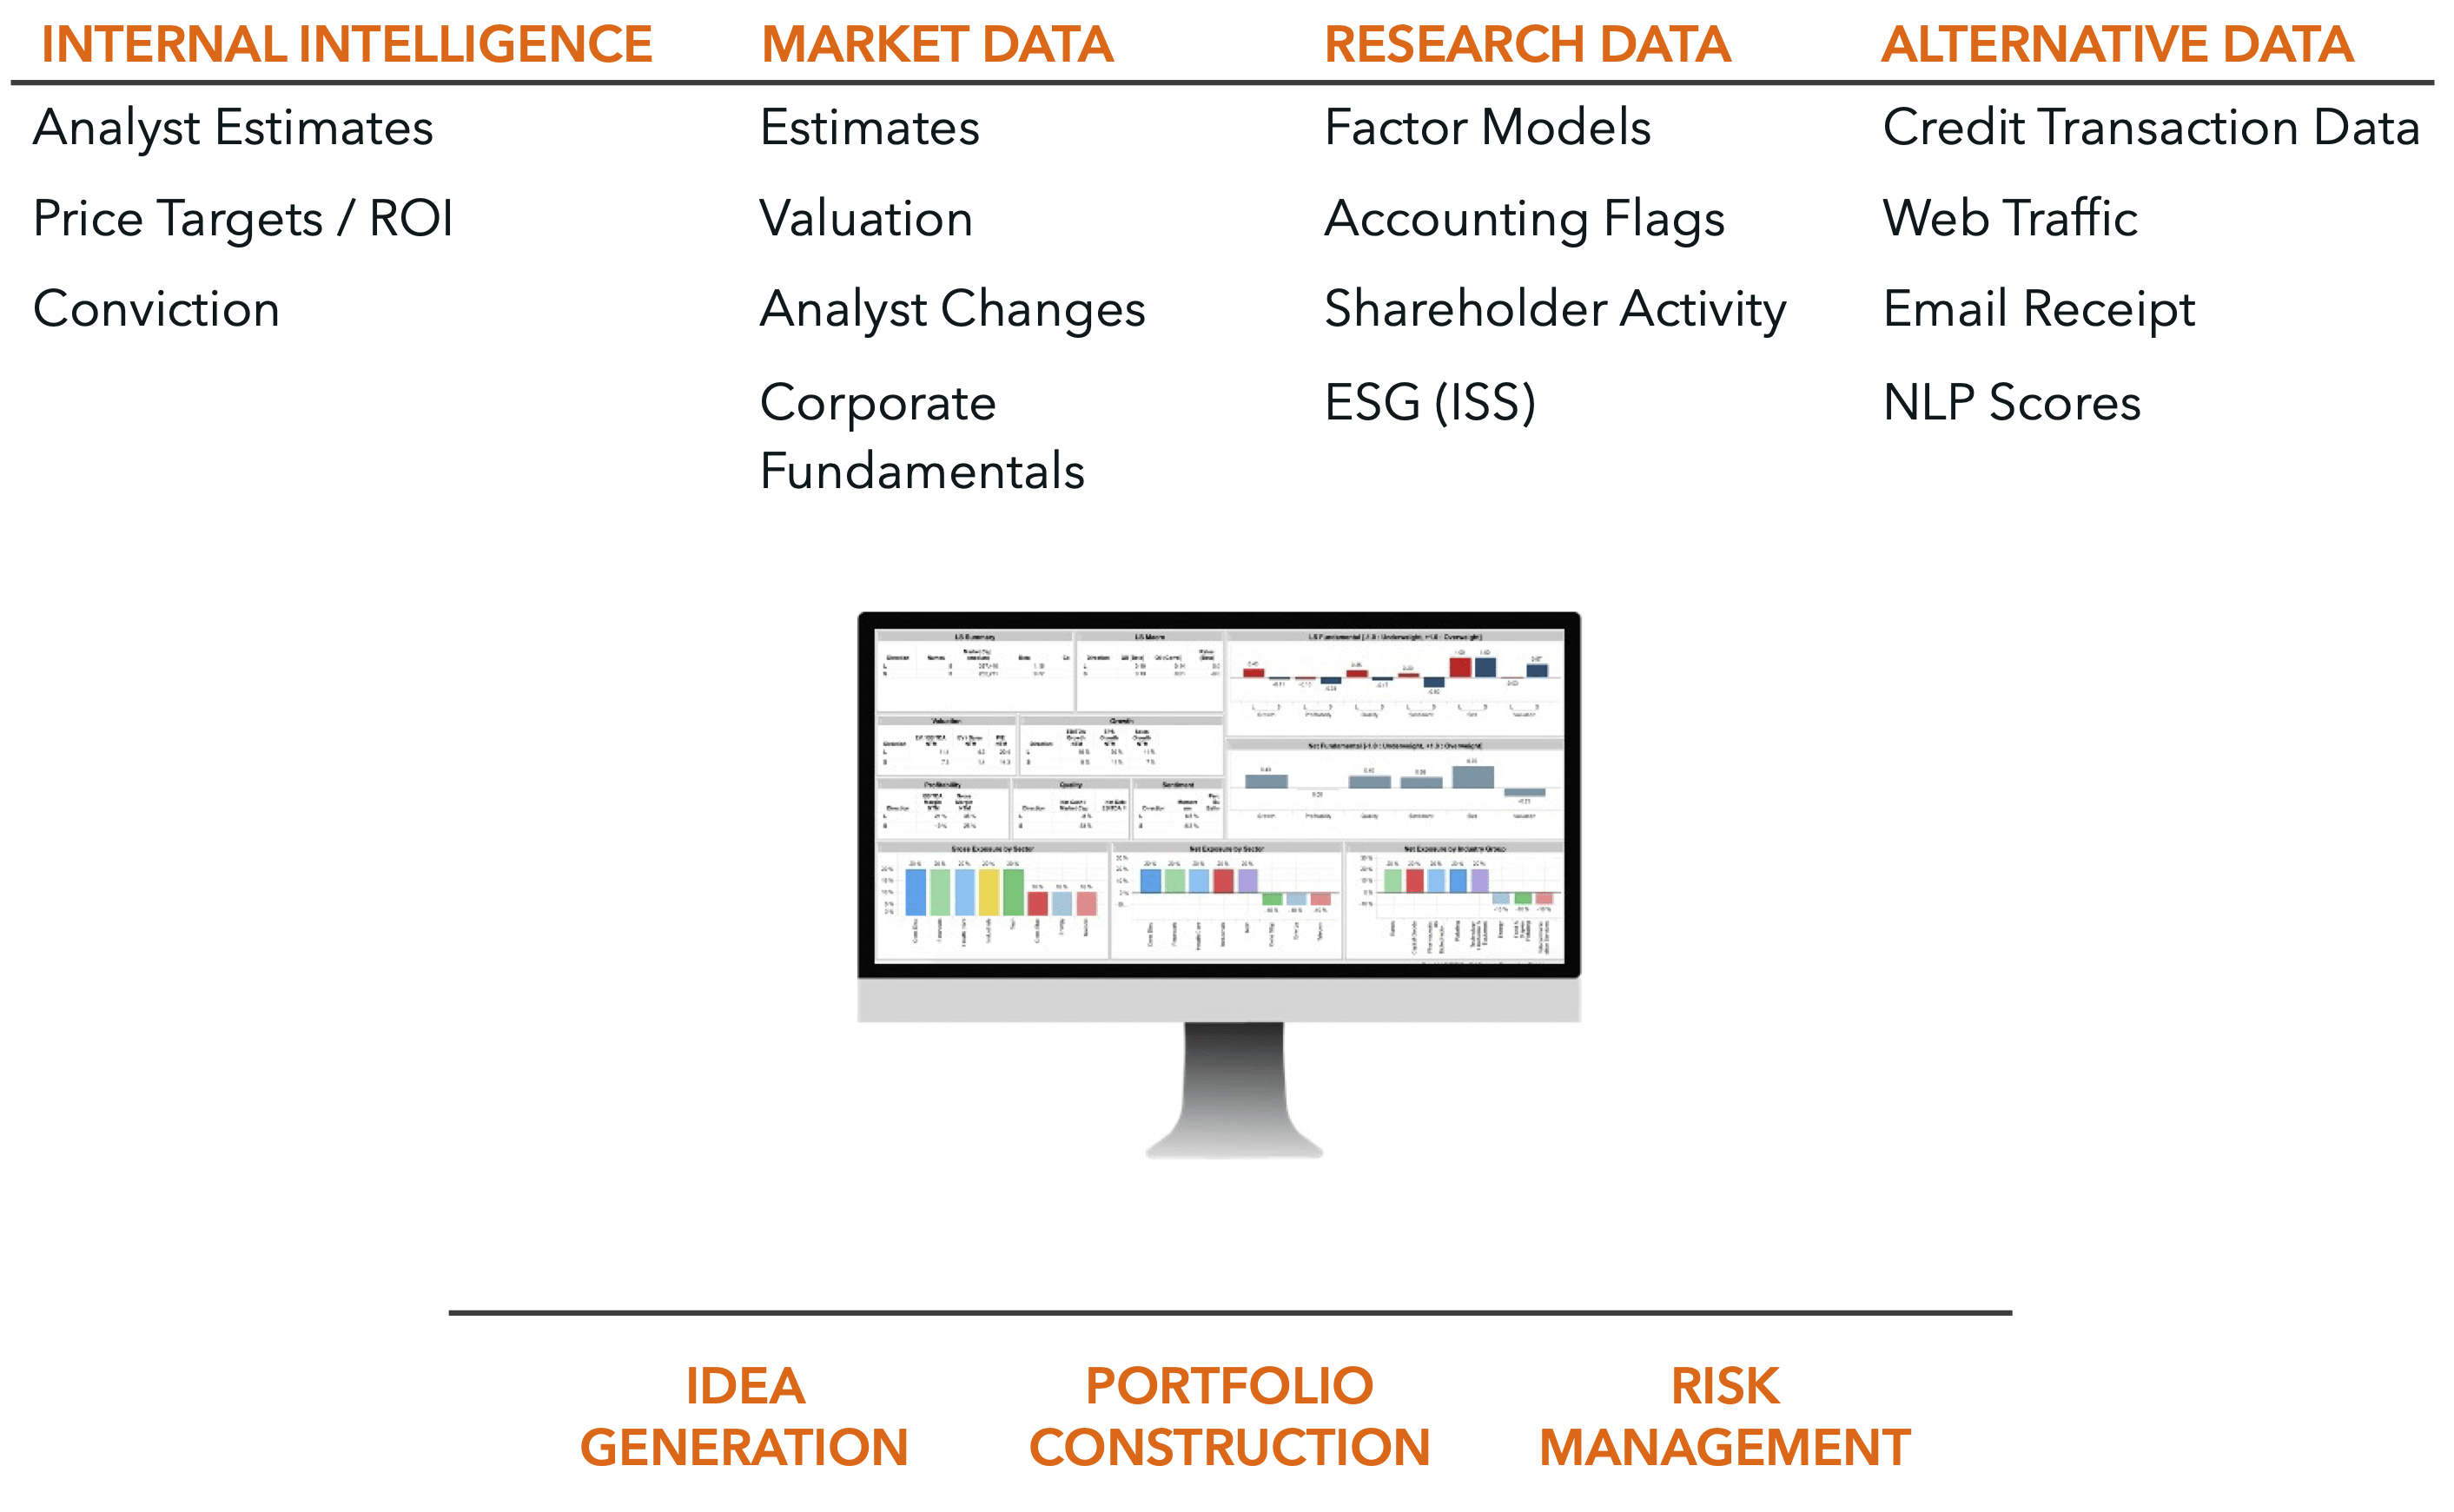
Using financial services as an example in the diagram above, “What to Do With All the KPIs,” this “Tower of Babel” of decisions on inputs will not scale using Excel and Powerpoint. The difficulty is that data comes from different sources, speaking languages including near-term and long-term fundamental business model KPIs, technology requirements, math and data science integrity, historical and peer valuation, and risk factor influences.
There are several critical challenges here:
- These inputs are like trying to compare apples, oranges, and pears.
- Per our example on the horse races, academic research shows after a certain level of inputs, analysts flatline their predictive ability (overwhelmed).
- There are almost no transparent or consistent feedback loops without a software system for tracking and monitoring.
We love to talk about ML/AI opportunities, but those don’t exist until one has the data in a system with feedback loops.
Read another article in this 8 part series:
- Part 1: Introduction
- Part 2: The Importance of Storytelling
- Part 3: Applying Process in Financial Workflow
- Part 4: Turning Questions into Predictions
- Part 5: sustainability: Making Good Intentions Real Through Great Process
- Part 6: What is Driving the Stock?
- Part 7: Blending Inputs, Feedback Loops and Implementing Metrics the Matter
- Part 8: Bringing it Home and Upgrading your Roadmaps